02 Apr Defining a Recession
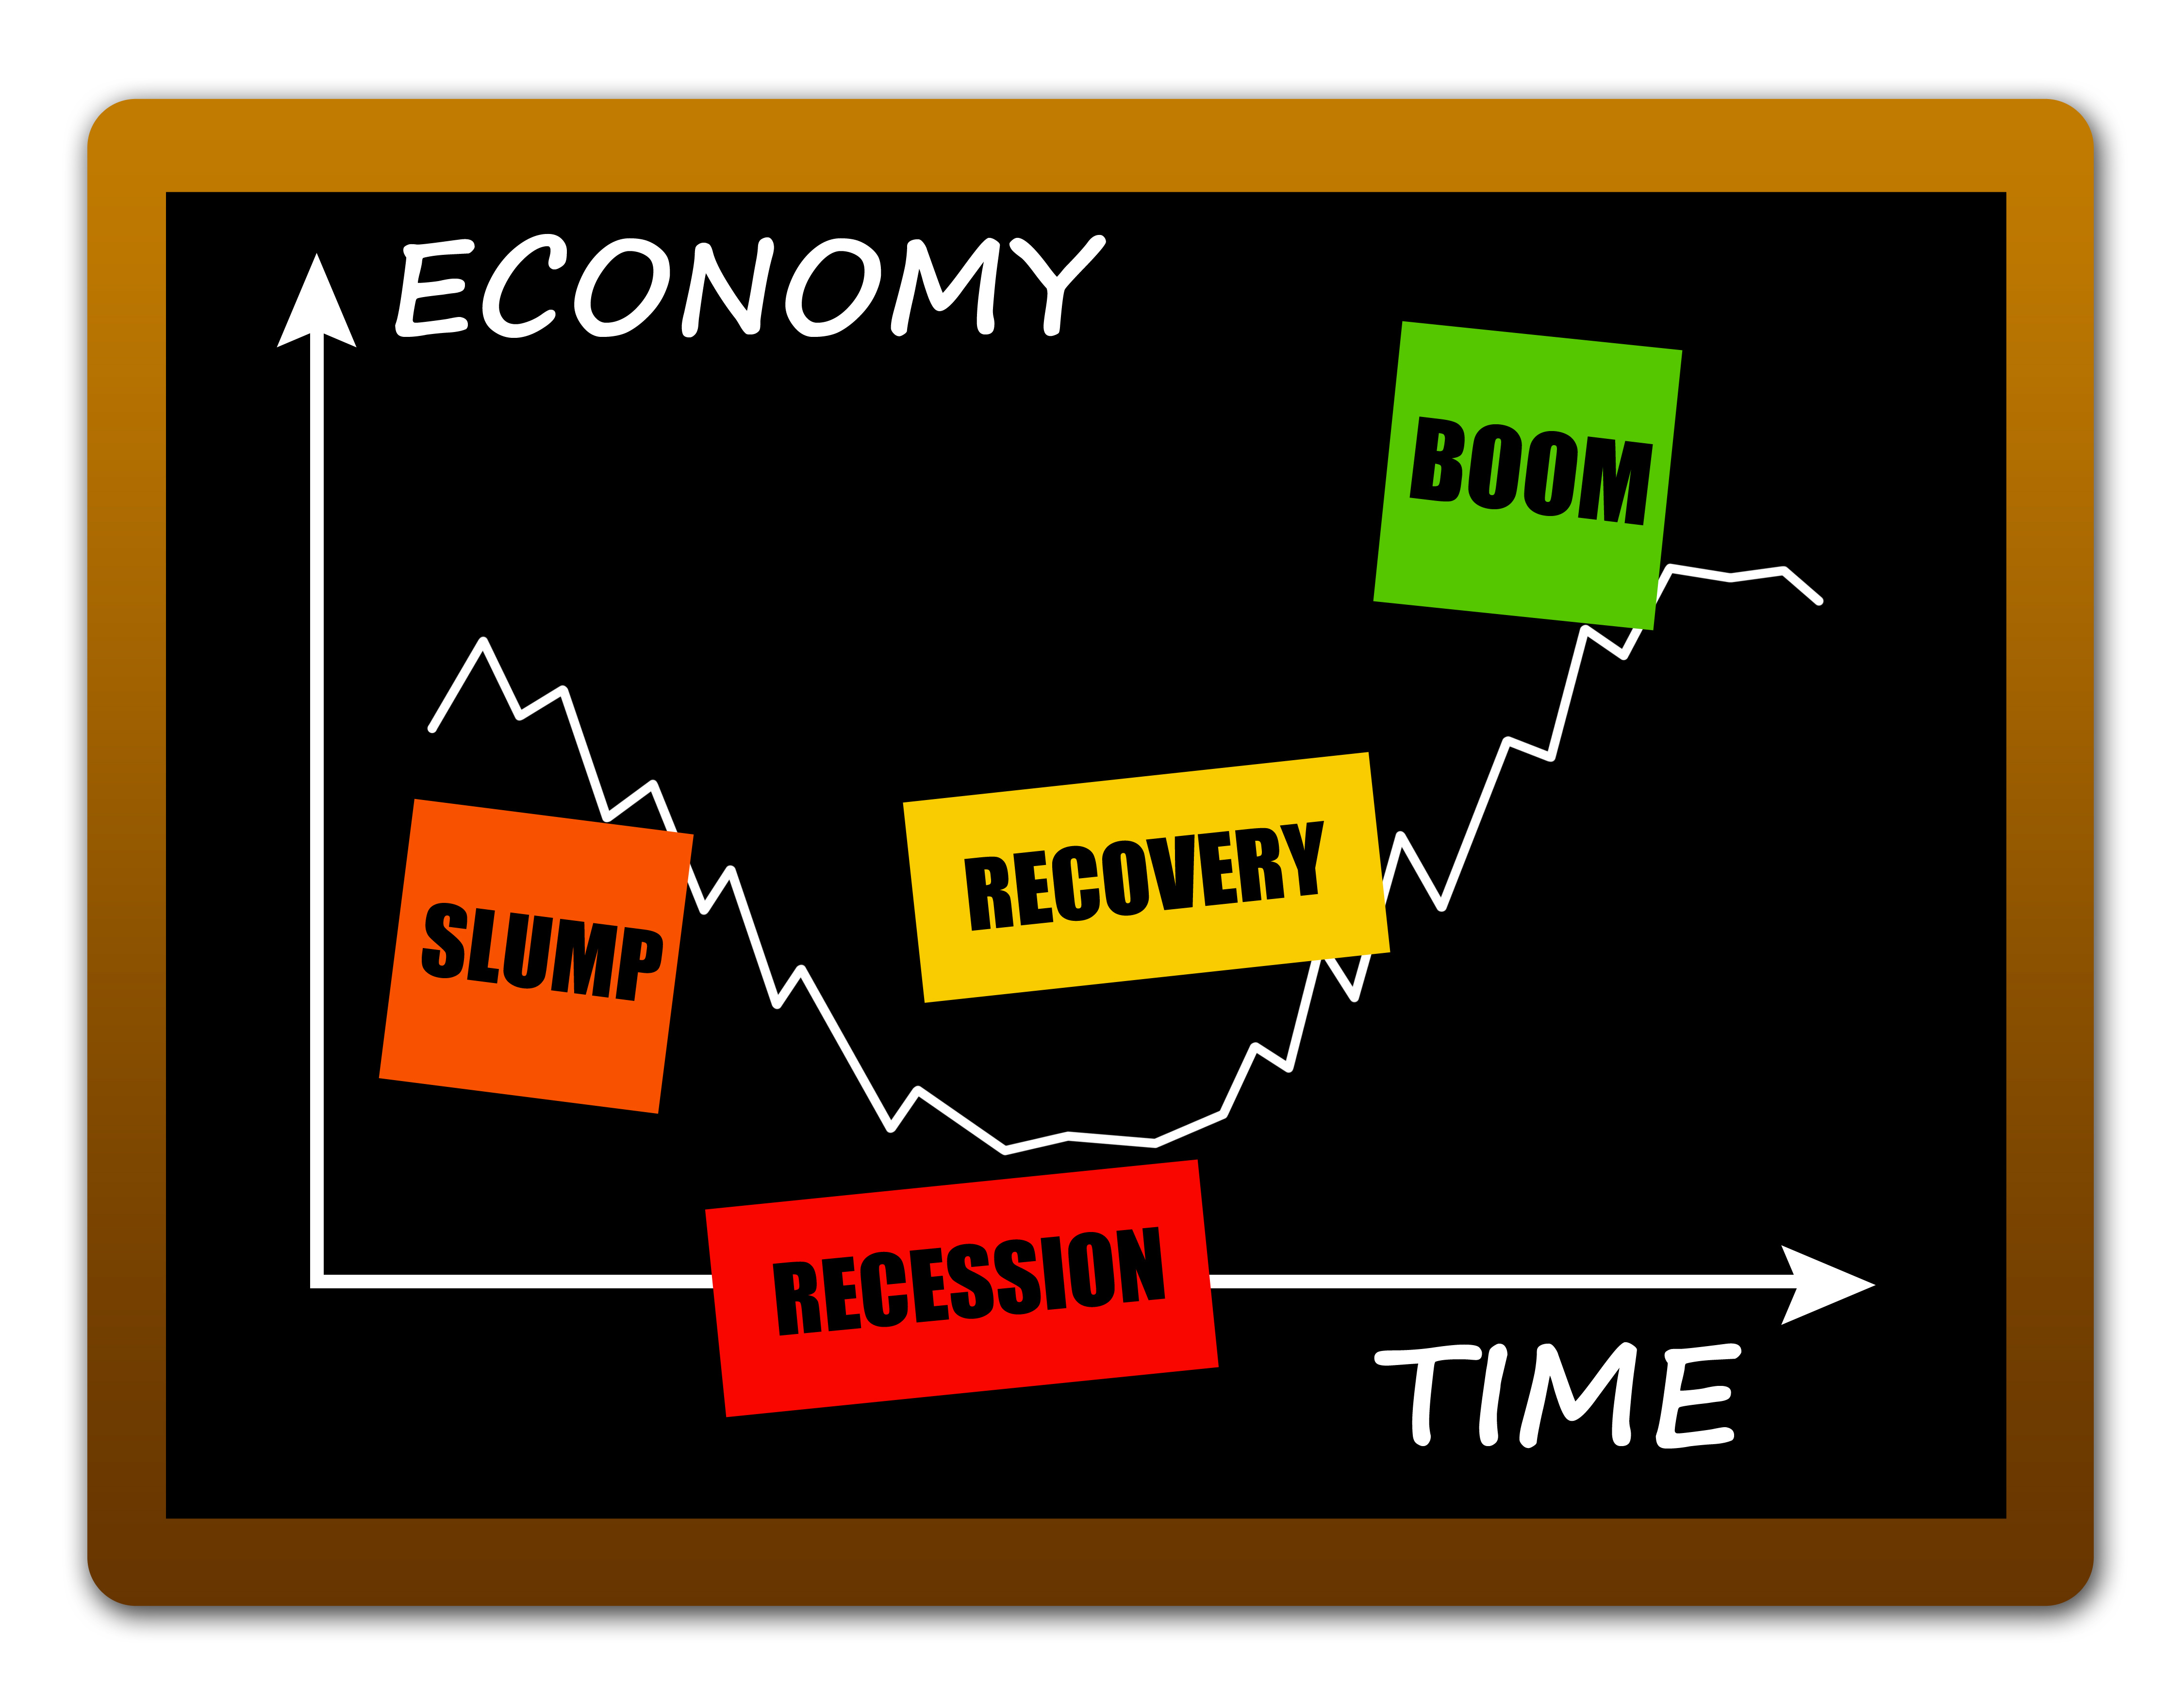
Given the seemingly non-ending talk about a recession, inverting yield curves and such, you might think that economists are channeling Paul Revere’s midnight ride, “A recession is coming! A recession is coming!”
Well, a recession is eventually inevitable, but the question is when?
The long-running expansions of the 1960s, 1980s, and 1990s gave rise to talk that a combination of fiscal and monetary policy may have ended the risk of a recession. Such talk was premature.
Today, the pendulum has swung in the opposite direction. Analysts and short-term traders have become hypersensitive to any signs a recession may be looming.
Moreover, the public has taken notice. A quick review of Google Trends bears this out. Google searches for the word “recession” have jumped 61% over the last six months versus the prior five years.
Stock market volatility and the steep correction late last year, the recent slowdown in U.S. economic activity, and an inverted yield curve (a more detailed review is forthcoming) have all contributed to worries about an economic downturn.
Plus, the economic expansion is fast approaching its 10-anniversary. If the economy is still expanding in July, and odds suggest it will be, the current expansion will become the longest on record, exceeding the expansion of the 1990s, which lasted exactly 10 years.
Recessions are a part of the business cycle in a free market economy. But expansions don’t simply peter out. Expansions come to an end when economic and financial imbalances arise, such as a stock or housing bubble, or the Fed aggressively hikes rates in response to a spike in inflation.
That brings us to the question…
What is a recession?
Contrary to the more traditional definition, a recession is not defined as two consecutive quarters of negative real (inflation-adjusted) GDP. If that were the case, we would have narrowly missed a recession in 2001. Q1 and Q3 posted negative numbers. Q2 was positive (St. Louis Fed).
Instead, an organization called the National Bureau of Economic Research (NBER) has become the official arbiter of recessions. Founded in 1920, the NBER is a private, nonprofit, nonpartisan organization dedicated to conducting economic research.
The NBER defines a [[http://www.nber.org/cycles/r/recessions.html]] as “a significant decline in activity spread across the economy, lasting more than a few months.” It manifests itself in the data tied to “industrial production, employment, real income, and wholesale-retail sales.”
These are very broad categories. They are not tied to one or two sectors, which might be experiencing weakness at any given time.
For example, during a recession, we’d expect to see declining retail and business sales. This would lead to a decline in industrial production and a rise in the unemployment rate.
It’s not as if the NBER confirms a recession has begun shortly after it begins. It took nearly a year for the NBER to confirm the last recession. By then, it was a foregone conclusion. A similar delay occurs when the economy begins to recover, and the NBER is tasked with calling the end of the recession.
Why do we care about recessions?
There are plenty of reasons. For most Americans, job insecurity increases, layoffs rise, and it becomes much more difficult to find work.
For investors, it’s a time of heavy uncertainty. Bear markets–a 20% or greater decline in the S&P 500 Index–are typically tied to recessions, as corporate profits decline and companies warn about the future.
The canary in the coal mine
Economists have always had trouble forecasting an upcoming recession. A few get it right; most miss it.
But it’s not as if we lack warning signs.
The Conference Board compiles what is called the Leading Economic Index®, or LEI. It’s akin to Paul Revere’s midnight ride. It has historically warned of an impending recession, but the timing is in question.
There are 10 components of the LEI. These are leading predictors of economic activity:
- Average weekly initial claims for unemployment insurance
- Building permits for homes
- 500 common stocks
- 10-year Treasury bond less federal fund rate (yield curve–more on this in a moment)
- Average weekly hours for manufacturing,
- New orders for consumer goods and materials
- The ISM® Index of New Orders
- New orders for nondefense capital goods ex-aircraft
- Average consumer expectations for business conditions
- Leading Credit Index™
I get that the list may seem a little overwhelming and some categories are less familiar than others. That said, the Conference Board plugs each months’ numbers into a formula and reports on the LEI every month.
Why do we call them leading indicators? Simply because they tend to foreshadow future economic activity.
Why 10? One or two might send out false signals. That’s less likely with a compilation.
How do leading indicators work? Take first-time claims for unemployment insurance. When economic activity slows, we’d expect layoffs to tick higher. We might also expect stock prices to decline. And falling building permits would likely signal upcoming weakness in housing.
Given the LEI, why is it so difficult to forecast a recession? Looking back at the last seven recessions (back to the 1969-70 recession), the lead time given by the LEI has ranged from 7-20 months ([[https://www.advisorperspectives.com/dshort/updates/2019/03/21/conference-board-leading-economic-index-expanding-in-near-term Advisor Perspectives]]). That’s quite a range.
Furthermore, there have been times when the LEI has given false recessionary signals, including the mid-1960s, the mid-1990s, the late 1990s, and during the recent expansion.
These “false positives” were temporary downticks. Nonetheless, the short-term declines could have been construed as a recessionary signal.
A cautiously upbeat signal
According to the Conference Board, the LEI has essentially been flat since October. It has correctly signaled a slowdown in the economy, but it has not signaled a recession.
In fact, a [[https://www.conference-board.org/pdf_free/economics/2019_03_13.pdf March report by the Conference Board entitled, “Fading Domestic Headwinds Will Keep Growth Above Trend,”]] is cautiously encouraging.
A shift in the atmosphere and a pivot by the Fed
During the third quarter of 2018, the economy was firing on all cylinders. At the September meeting of the Federal Reserve, policymakers were projecting three rate hikes in 2019–all 0.25 percentage point increases.
The Fed cut its forecast to two rate increases at the December meeting amid stock market uncertainty and signs U.S. growth was moderating.
At the conclusion of the March meeting, the Fed said it sees no rate hikes this year.
Furthermore, Fed Chief Jerome Powell was forced to push back on talk of a possible rate cut this year, arguing at his press conference that he expects “the economy will grow at a solid pace in 2019.”
The pivot is complete.
The kink in the curve–inversion
Recall the list of leading indicators. Number 4: the yield curve.
Normally, the yield curve is upward sloping. As the maturity of bonds lengthen, the investor receives a higher yield. Think of it like this: you expect to receive a higher interest rate on a two-year CD than a six-month CD.
But there are times when the yield curve inverts. Shorter-dated bonds yield more than longer-dated bonds.
On March 22, the yield on the three-month T-bill exceeded that on the 10-year Treasury by 0.02 percentage points (U.S. Treasury Dept). That hasn’t happened since 2006.
Importance: the last seven recessions (going back to the 1969-70 recession–using NBER data and data from the St. Louis Federal Reserve) have all been preceded by an inversion of the yield curve. We must go back to 1966 when a brief inversion was followed by a steep slowdown in growth and not a recession.
On average, a recession ensued 11 months later.
An inverted curve is signaling that investors believe short-term rates will eventually come down in response to a weaker economy. It may also hamper lending by banks.
But, is it different this time? “It’s different this time” a four-word phrase that should always set off alarm bells. Usually, it isn’t. But are we getting confirmation from other signals?
- Another strong recession predictor is an inversion of the 10-year/2-year Treasury. That has not occurred, as the 2-year yield has been falling along with the 10-year.
- The Conference Board’s Leading Index has been flat since October, signaling the slowdown in U.S. growth. But it has not declined.
- In addition, weakness in Europe has pushed yields down sharply overseas (Bloomberg), which may be encouraging some global investors to park money into higher-yielding U.S. bonds.
- The Fed is no longer eyeing rate hikes, and financial conditions have eased during the first quarter.
Recessions have typically been preceded by major economic imbalances, such as a stock market bubble or housing bubble. Or, a sharp rise in inflation forces the Fed to aggressively respond with rate hikes.
For the most part, neither conditions are currently present, lessening odds a near-term recession is lurking. Further, recent market action has been impressive. It’s not as if we haven’t seen some volatility, but year-to-date performance isn’t signaling an economic contraction is imminent.
Let me emphasize that it is my job to assist you! If you have any questions or would like to discuss any matters, please feel free to give me or any of my team members a call.
As always, I’m honored and humbled that you have given me the opportunity to serve as your financial advisor.


